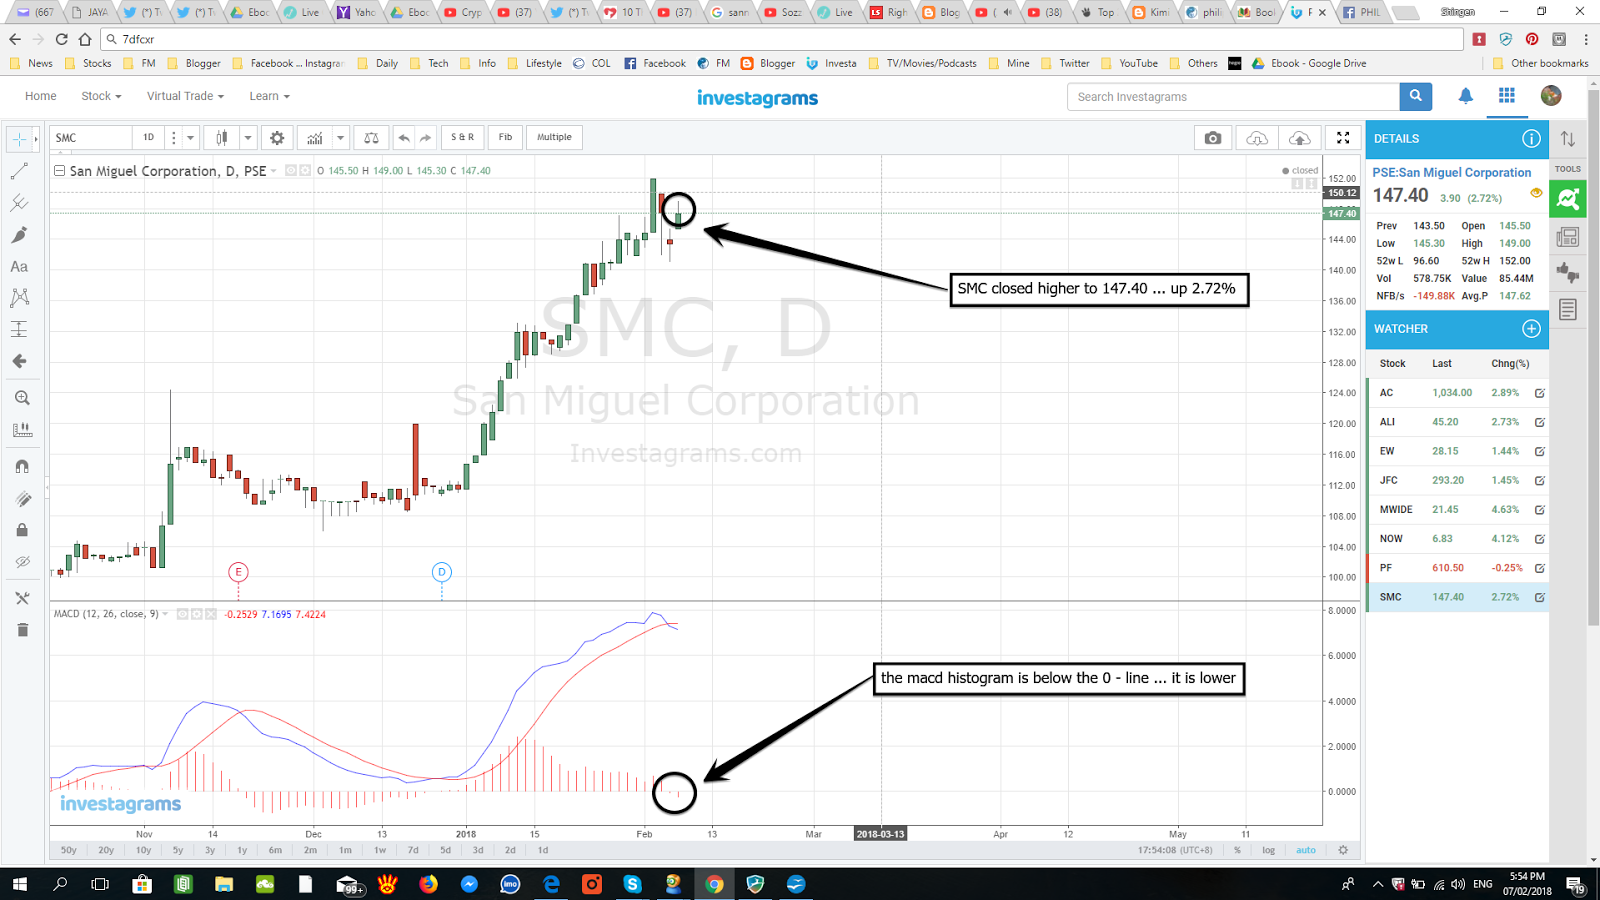
SMC chart as of closing of 07 FEB 2018
the chart is courtesy of INVESTAGRAMS(click the chart to enlarge)
1. the macd histogram is below the 0 - line ... it is lower ...
2. SMC closed higher to 147.40 ... up 2.72% ...
3. if i were a short term trend follower ... i may buy SMC now ... cutloss just below: 141.10 (example: 141.00) ...
***follow me at finance manila
*my buy criteria: i buy when the following happens:
1. the macd histogram is below the 0 - line
2. the histogram is higher or the price is higher than the most recent lowest low
* what is a "short term trend follower"
* these notes are good only for the next trading day ... and NOT for the subsequent trading days
* these notes are mine alone ... and are for sharing with short-term trend followers
STOCK TRADING IS A VERY SPECULATIVE ACTIVITY ... IT IS NOT SAFE FOR NEWBIES AND OLDIES ALIKE ... LOSING YOUR MONEY IS A REAL POSSIBILITY AT ALL TIMES!
p.s. readers are encouraged to check out the stocks' charts themselves .. using the values for each of the indicators (my values for the indicators are the default values used in the INVESTAGRAMS charts) ...
------------------------------------------------------------------------------------------