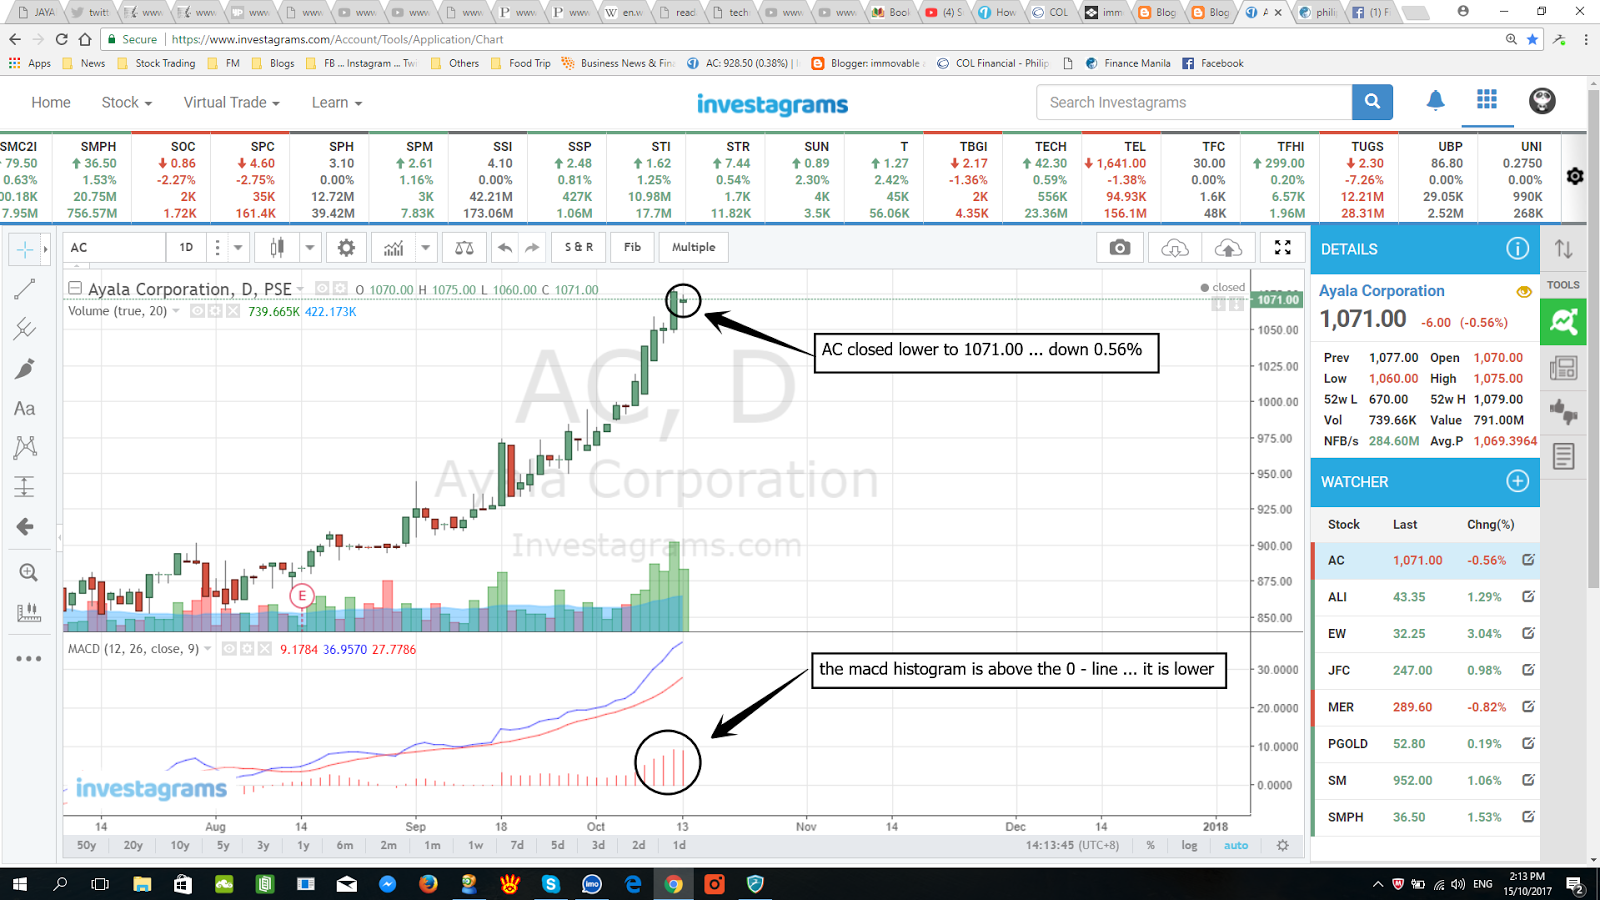
AC chart as of closing of 13 OCT 2017
the chart is courtesy of INVESTAGRAMS
(click the chart to enlarge)
remarks:
1. the macd histogram is above the 0 - line ... it is lower ...
2. AC closed lower to 1071.00 ... down 0.56% ...
3. if i were a short term trend follower* ... and i have AC ... sell lang ako kung tamaan na ang stops ko ... my stops: just below 1060 ... or jusr below 1050 ... or just below 1000 ...
* what is a "short term trend follower"
* these notes are good only for the next trading day ... and NOT for the subsequent trading days
* these notes are mine alone ... and are for sharing with short-term trend followers
for more philippine stock market views and information please check:

FINANCE MANILA
STOCK TRADING IS A VERY SPECULATIVE ACTIVITY ... IT IS NOT SAFE FOR NEWBIES AND OLDIES ALIKE ... LOSING YOUR MONEY IS A REAL POSSIBILITY AT ALL TIMES!
p.s. readers are encouraged to check out the stocks' charts themselves .. using the values for each of the indicators (the values for the indicators are the default values used in citiseconline.com's charts) ... in the absence of any personal charting program, the pse website's charts are enough for the purpose.
------------------------------------------------------------------------------------------