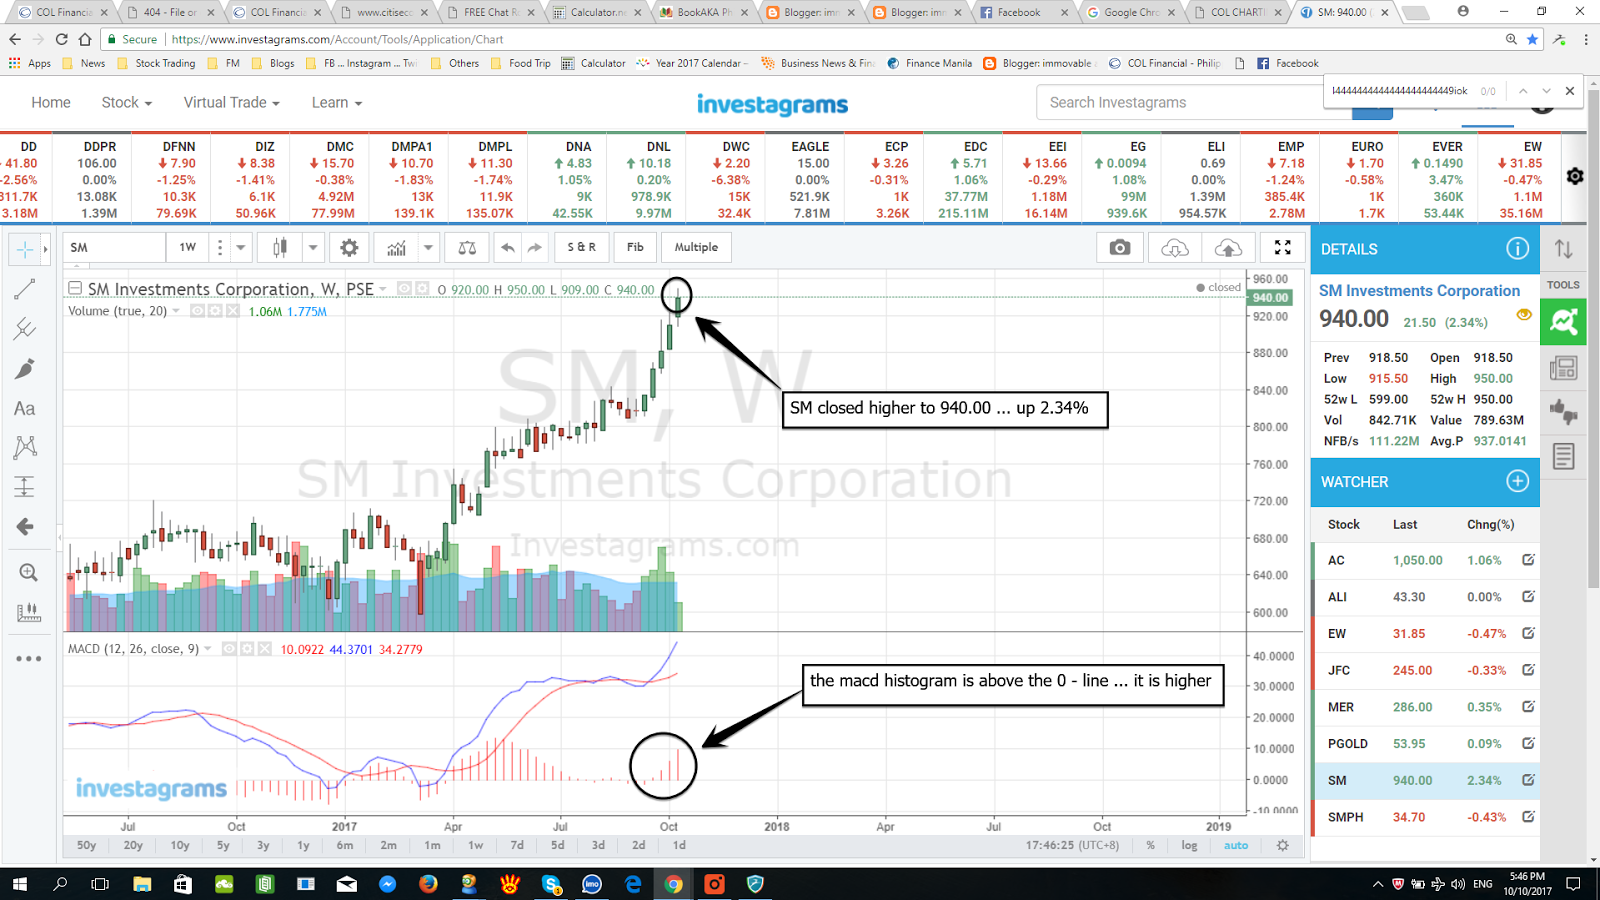
SM chart as of closing of 10 OCT 2017
the chart is courtesy of INVESTAGRAMS
(click the chart to enlarge)
remarks:
1. the macd histogram is above the 0 - line ... it is higher ...
2. SM closed higher to 940.00 ... up 2.34% ...
3. if i were a short term trend follower* ... and i want to enter SM ... id wait muna ... pataas pa din ang macd histogram ... id wait for the macd to go under the 0 - line first ...
- i have some SM ... profit na ako ... just letting my pofits run ...
* what is a "short term trend follower"
* these notes are good only for the next trading day ... and NOT for the subsequent trading days
* these notes are mine alone ... and are for sharing with short-term trend followers
for more philippine stock market views and information please check:

FINANCE MANILA
STOCK TRADING IS A VERY SPECULATIVE ACTIVITY ... IT IS NOT SAFE FOR NEWBIES AND OLDIES ALIKE ... LOSING YOUR MONEY IS A REAL POSSIBILITY AT ALL TIMES!
p.s. readers are encouraged to check out the stocks' charts themselves .. using the values for each of the indicators (the values for the indicators are the default values used in citiseconline.com's charts) ... in the absence of any personal charting program, the pse website's charts are enough for the purpose.
------------------------------------------------------------------------------------------